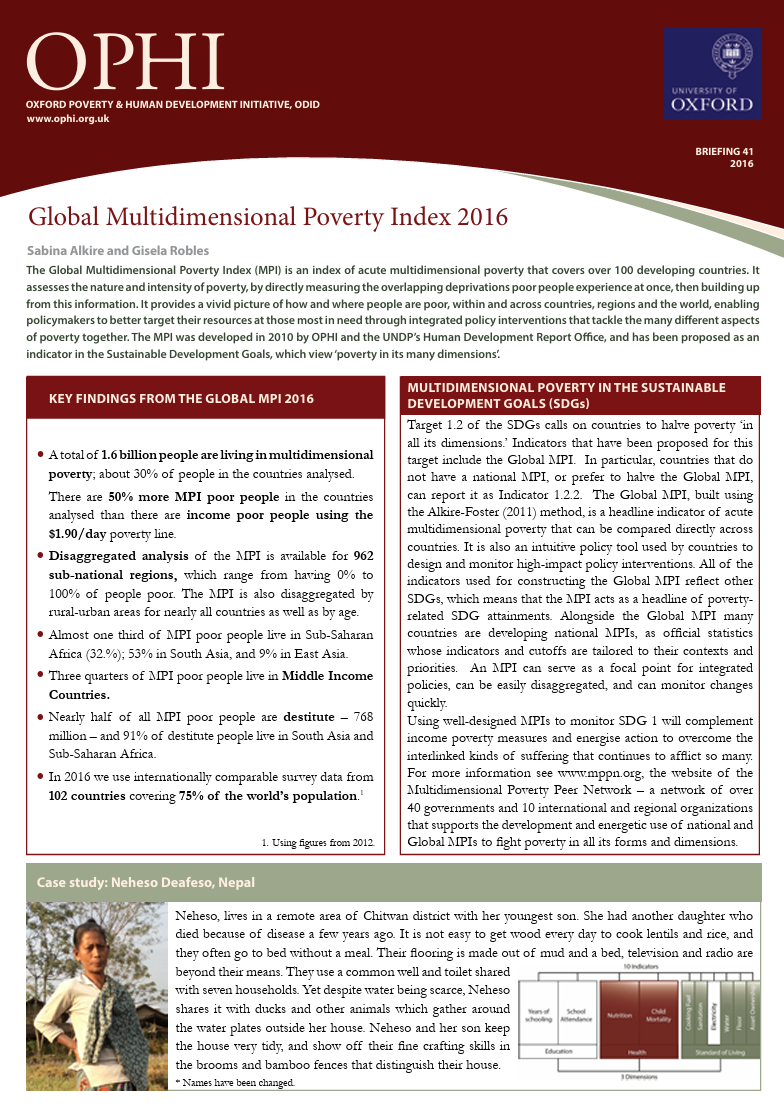
Global MPI Winter 2017/2018
The Global MPI was updated in January 2018 and now covers 104 countries in total, which are home to 76 per cent of the world’s population, or 5.5 billion people. Of this proportion, 26.5 per cent of people (1.46 billion) are identified as multidimensionally poor.
Our analysis of global multidimensional poverty covered a number of topics, such as destitution, regional and sub-national variations in poverty, the composition of poverty.
Data tables
Global MPI Data Tables for Winter 2017/2018
Brief methodological note on the Winter 2017/2018 updates
Tables 1.1-2.3 | Main MPI results, headcount ratio by dimensions, contribution of deprivations and other measures of poverty and wellbeing at the national level (104 countries). Download |
Tables 3.1-4.3 | Multidimensional poverty, headcount ratio by dimension and contribution of deprivations in rural and urban areas (104 countries). Download |
Tables 5.1-5.4 | Multidimensional poverty, headcount ratio by dimension and contribution of deprivations at the sub-national level. Download |
Table 7 | The table presents an archive of all MPI estimations published since 2010. These are not harmonized for comparisons over time. Table 7 covers 256 estimations for 120 countries in 2016. Download |
Global MPI 2017: Key findings
This page highlights findings from the Global Multidimensional Poverty Index (MPI) and provides a range of resources. The Global MPI was updated in June 2017 and now covers 103 countries in total, which are home to 76 per cent of the world’s population, or 5.4 billion people. Of this proportion, 26.5 per cent of people (1.45 billion) are identified as multidimensionally poor.
Key findings
In June 2017, our analysis of global multidimensional poverty spans a number of topics, such as destitution, regional and sub-national variations in poverty, the composition of poverty.
Key findings include:
- A total of 1.45 billion people from 103 countries are multidimensionally poor (considering 2013 population data); 26.5% of the people living in these countries.
- 48% of the poor people live in South Asia, and 36% in Sub-Saharan Africa.
- Most MPI poor people – 72% – live in middle income countries.
- Half of the multidimensionally poor (48%) are children aged 0-17.
- Nearly half of all MPI poor people are destitute – 706 million – so experience extreme deprivations like severe malnutrition in at least one-third of the dimensions.
- In Uganda, 22% of people live in a household where at least one person experiences a severe disability. Poverty in these households is higher: 77% of people are poor vs 69% in other households.
- The MPI and its indicators are disaggregated by 988 subnational regions in 78 countries. The poorest regions are in Chad, Burkina Faso, Niger, Ethiopia, South Sudan, Nigeria, Uganda, and Afghanistan. Inside Afghanistan poverty rates vary from 25% in Kabul to 95% in Urozgan.
Policy briefings
Download briefing papers on:
- 16-page analysis of main results on the global MPI 2017.
- Children’s multidimensional poverty: Disaggregating the global MPI. This briefing disaggregates the 2017 global MPI by age group to analyse the situation of 1.8 billion children who live in 103 countries.
Regional Highlights
Briefing papers highlighting key findings are available for the following regions:
- Arab States
- East Asia and the Pacific
- Europe and Central Asia
- Latin America and Caribbean
- South Asia
- Sub-Saharan Africa
Data tables
Global MPI Data Tables for 2017
Brief methodological note on the Summer 2017 updates (pdf).
Citations
Please cite data tables 1.1 – 8 as: Citation: Alkire, S. and Robles, G. (2017). “Multidimensional Poverty Index Summer 2017: Brief methodological note and results.” OPHI Methodological Note 44, University of Oxford.
Please note Table 7 also draws upon the following papers from previous years:
Multidimensional Poverty Index – Summer 2016: Brief Methodological Note and Results
Multidimensional Poverty Index – Summer 2015: Brief Methodological Note and Results
Multidimensional Poverty Index 2014: Brief Methodological Note and Results
Multidimensional Poverty Index 2013: Brief Methodological Note and Results
Multidimensional Poverty Index 2011: Brief Methodological Note
Alkire, S. and Santos, M. E. (2010). “Acute multidimensional poverty: A new index for developing countries.” OPHI Working Papers 38, University of Oxford.
Further resources
Further information can be found in our country-specific briefings, interactive databank and Global MPI data tables.
Global Winter MPI update
The 2016 Winter MPI presents updated estimations for 9 countries:
- Algeria (MICS 2012-13),
- Chad (DHS 2014-15),
- Guyana (MICS 2014),
- Lesotho (DHS 2014),
- Mongolia (MICS 2013),
- Sudan (MICS 2014),
- Sao Tome and Principe (MICS 2014),
- Thailand (MICS 2012).
- What’s new: We updated: Algeria, Chad, Dominican Republic, Guyana, Lesotho, Mongolia, Sao Tome and Principe, Sudan, Thailand using more recent datasets. The winter MPI update covers 103 countries, home to 5.86 billion people, of whom 1.55 billion are poor, making the global poverty rate 29.4%. [these estimates use 2012 population data].
- Chad is the poorest country of the set that were just updated, followed by Sudan. The poorest subnational regions in Chad are now the drought-affected regions of Lac, Wadi Fira, Sila and Kanem. We cannot compare the MPI of Chad using 2014/15 data directly to the earlier MPI because the MPI 2014/15 is improved by including undernutrition data on women as well as children. However the current figures are distressing. For example over half (52%) of the population are multidimensionally poor and have a school-aged child at home who is not attending school, and over 80% of the population are poor and lack electricity, adequate sanitation, flooring, and clean cooking fuel. Alarmingly, in the regions of Lac and Kanem, nearly 65% of the population are poor and have at least one malnourished woman or child at home
- Data in the Poorest Countries: In 52 countries, 20% or more of the population are multidimensionally poor. So these ‘poorest’ countries are about one-half of the countries included in the global MPI. Are their data also weaker? Actually, not at all! Fifty-one of the 52 countries have all 10 MPI indicators; Afghanistan lacks the nutrition indicator. 45 of these countries have data that are from 2010 or later, and for 28 countries the data are 2012-2015. Furthermore, using publicly available data, mainly from DHS and MICS surveys, 49 of these countries can be disaggregated into 603 subnational region (all of the 52 poorest countries except Somalia, Guinea-Bisseau, and Vanuatu can be disaggregated by region), to provide a high-resolution picture of deprivation – and all are decomposable by rural and urban areas.
-
Global MPI June 2016
This page highlights findings from the Global Multidimensional Poverty Index (MPI) and provides a range of resources. The Global MPI was updated in June 2016 and now covers 102 countries in total, which are home to 75 per cent of the world’s population, or 5.2 billion people. Of this proportion, 30 per cent of people (1.6 billion) are identified as multidimensionally poor.
Briefings – data tables – methodology
Key findings
- Over half (54%) of people in the African countries analysed suffer from multidimensional poverty: 544 million people endure multidimensional poverty in 46 countries analysed in the region.
- Among 35 countries where changes to poverty over time were analysed, 30 of them have reduced poverty significantly. Rwanda had stellar performance.
- The MPI registered impressive reductions in some unexpected places. 19 sub-national regions – regional ‘runaway’ successes – have reduced poverty even faster than Rwanda. The fastest MPI reduction was found in Likouala in the Republic of the Congo.
- The Sahel and Sudanian Savanna Belt contains most of the world’s poorest sub-regions, showing the interaction between poverty and harsh environmental conditions.
- Poverty looks very different in different parts of the continent. While in East Africa deprivations related to living standards contribute most to poverty, in West Africa child mortality and education are the biggest problems.
- The deprivations affecting the highest share of MPI poor people in Africa are cooking fuel, electricity and sanitation.
- More people tend to suffer from MPI poverty than $1.90/day poverty. Yet nine important exceptions, where income poverty exceeds MPI, are in Africa. The number of people in multidimensional poverty in East Africa outnumbers those in West Africa, but we would not get similar conclusions if we only focus on income poverty.
- East and West Africa have the largest number of poor people both in terms of income and multidimensional poverty. North Africa is the least poor region.
- The number of poor people went down in only 12 countries. In 18 countries, although the incidence of MPI fell, population growth led to an overall rise in the number of poor people.
Download briefing papers on key findings:
- 2-page at a glance highlights
- Multidimensional Poverty in Africa: 2016 Special Briefing: download in English French
Data tables
Detailed MPI data is available to download from the tables below. Tables 1.1 – 7 were updated in June 2015 and are appendices to the Methodological Note – Summer 2016. They include:
- Detailed MPI results at the country level (102 countries)
- Breakdown of MPI results by rural and urban areas (100 countries)
- MPI at the sub-national level for 962 regions of 78 countries
- Changes to multidimensional poverty over time for 50 countries and their sub-national regions where possible
The tables are divided into sheets to help in navigating through the data. The chart below provides detailed information on what is included in each data table and sheet. You can download the tables by clicking on the icons in the right-hand column.
Citations of data and tables
Please cite data tables 1.1 – 7 as: Citation: Alkire, S., Jindra, C., Robles, G., and Vaz, A. (2016). “Multidimensional Poverty Index 2016: Brief methodological note and results.” OPHI Briefing 42, University of Oxford.
Please note Table 7 also draws upon the following papers from previous years:
Multidimensional Poverty Index – Winter 2015/2016: Brief methodological note and results
Multidimensional Poverty Index 2015: Brief methodological note
Multidimensional Poverty Index – Winter 2014/2015: Brief methodological note and results
Multidimensional Poverty Index 2014: Brief methodological note and results
Multidimensional Poverty Index 2013: Brief methodological note and results
Multidimensional Poverty Index 2011: Brief methodological note
Alkire, S. and Santos, M. E. (2010). “Acute multidimensional poverty: A new index for developing countries.” OPHI Working Paper 38, University of Oxford.
Policy Briefings
Download briefing papers on key findings:
Regional Highlights
Briefing papers highlighting key findings are available for the following regions:
- Arab States
- East Asia and the Pacific
- Europe and Central Asia
- Latin America and Caribbean
- South Asia
- Sub-Saharan Africa
Further Resources
Further information can be found in our country-specific briefing interactive data bank and Global MPI data tables. You can also read Global MPI case studies and view our at-a-glance infographics.
Watch a video of the Global 2016 MPI Launch
Methodology