Global MPI 2018
Across the 105 countries covered by the global MPI, 1.3 billion people live in acute multidimensional poverty. This amounts to 23% of the 5.7 billion people living in these countries. The population covered by the 2018 global MPI represents 5.73 billion people, a total aggregated using 2016 population figures. The global MPI is disaggregated into 1127 subnational regions across 88 countries. In 2018, five of the ten indicators have been revised.
Our joint report
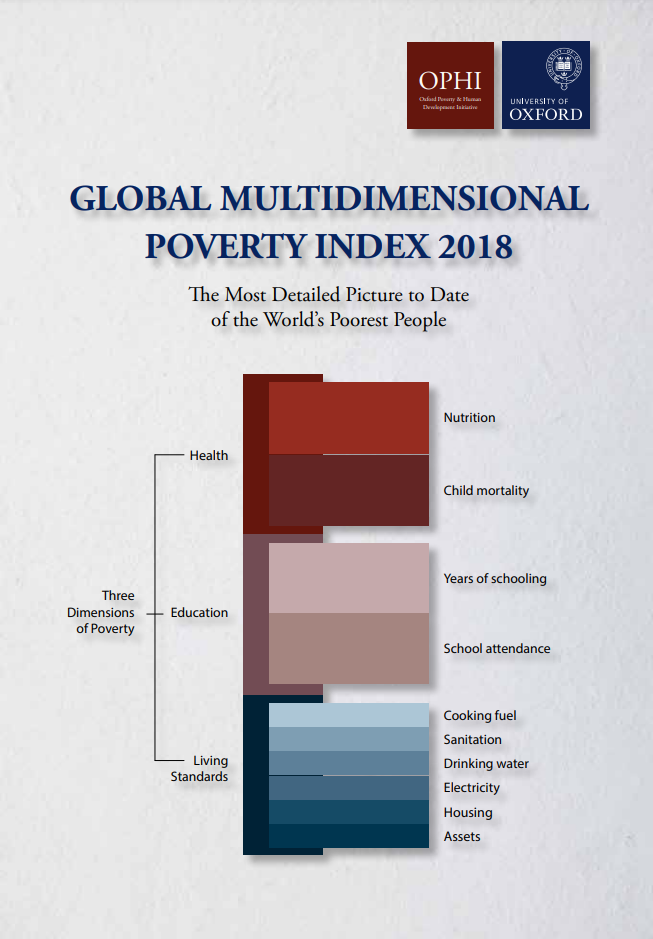
The Global Multidimensional Poverty Index 2018: The Most Detailed Picture to Date of the World’s Poorest People presents the global MPI 2018, a newly revised index based on a short but powerful list of 10 deprivations. The revised global MPI is the joint work of OPHI and UNDP. The overarching aim of the revised MPI is to better align the global MPI with the SDGs (Alkire and Jahan 2018).
- Chapter 1 provides a global overview of findings from the global MPI 2018
- Chapter 2 focuses on India, presenting a case study on MPI from 2005/06 to 2015/16, with analyses of trends by age, state, caste, and religion, and a direct mapping of poverty at the district level in 2015/16. Turning first to the youngest on our planet
- Chapter 3 assesses child poverty across all countries. Multidimensional poverty varies both within and across major geographic regions like Latin America or East Asia and the Pacific
- Chapter 4 presents some notable highlights. Going within countries
- Chapter 5 scrutinises poverty levels and composition across rural and urban areas
- Chapter 6 zooms in to investigate circumstances within and across countries according to subnational regions
Download the Introduction, chapter 1 and chapter 4 in Chinese.
Citation: OPHI (2018). Global Multidimensional Poverty Index 2018: The Most Detailed Picture to Date of the World’s Poorest People. Report. Oxford Poverty and Human Development Initiative (OPHI), University of Oxford. ISBN 978-1-912291-12-0.
Our data
- Data Table 1 presents the main MPI results, headcount ratio by dimensions, contribution of deprivations and other measures of poverty and wellbeing at the national level (105 countries).
- Data Table 2 presents multidimensional poverty, headcount ratio by dimension and contribution by different poverty cut-offs (105 countries).
- Data Table 3 presents multidimensional poverty, headcount ratio by dimension and contribution of deprivations by age groups.
- Data Table 4 presents multidimensional poverty, headcount ratio by dimension and contribution of deprivations in rural and urban areas (105 countries).
- Data Table 5.1-5.6 presents multidimensional poverty, headcount ratio by dimension and contribution of deprivations at the sub-national level, and Table 5a1-5a4 presents India disaggregation by district.
- Data Table 6 presents Changes over Time for India. The table presents an archive of all MPI estimations published since 2010. These are not harmonised for comparisons over time.
- Data Table 7 covers 361 estimations for 120 countries in 2018, of which 256 estimates are based on the original MPI and 105 estimates are based on the 2018 revised MPI.
Oxford Academic Licence
Our Country Briefings
The global MPI Country Briefings present the country-specific results for the countries in this year’s global MPI.
Documentation
Technical files
The do-files are the computational files that were used to create the MPI from each dataset in Stata.